Statistics
Statistics turn your logged records into charts and summaries, so you can see exactly where your time goes over a day, a week, a month, or any custom range. Open the 2nd tab and select from:
- Total Statistics
- Daily Statistics
- Daily Distribution chart
Statistics calculation
Before reviewing these screens, it’s important to understand how statistics are calculated. There are two non-obvious factors affecting results:
- Record Intersections
- Multi-Day Activities
Record intersections
Example: Bus ride (10 am - 11 am) and Reading (10:20 am - 11 am). There are two ways to calculate these:
Without intersections:
- Bus ride: 1 hour
- Reading: 40 minutes
With intersections:
- Bus ride: 20 minutes
- Bus ride + Reading: 40 minutes
Some users prefer calculations ‘with’ intersections, while others prefer ‘without’. You can adjust this in the ‘Statistics Calculation’ setting.
Info
Note that in the ‘without intersections’ method, the total tracked time may exceed 24 hours.
Multi-day Activities
The application works with 24-hour days, but some activities span multiple days. For example, sleeping from 10 pm to 7 am will be split as:
- 2 hours for the first day
- 7 hours for the seconds day
Typically, this isn’t a problem, especially for repeating activities like sleep. However, you can change the ‘Day Start’ time in Settings to better suit your needs.
Info
But what if you want to know exact progress based on duration and not calculated by day? In this case Goals will help
Total statistics
This screen displays total statistics as a pie chart with a legend below for the selected filter and period. Options include:
- By Time (Duration) or Occurrence
- Display Untracked Time
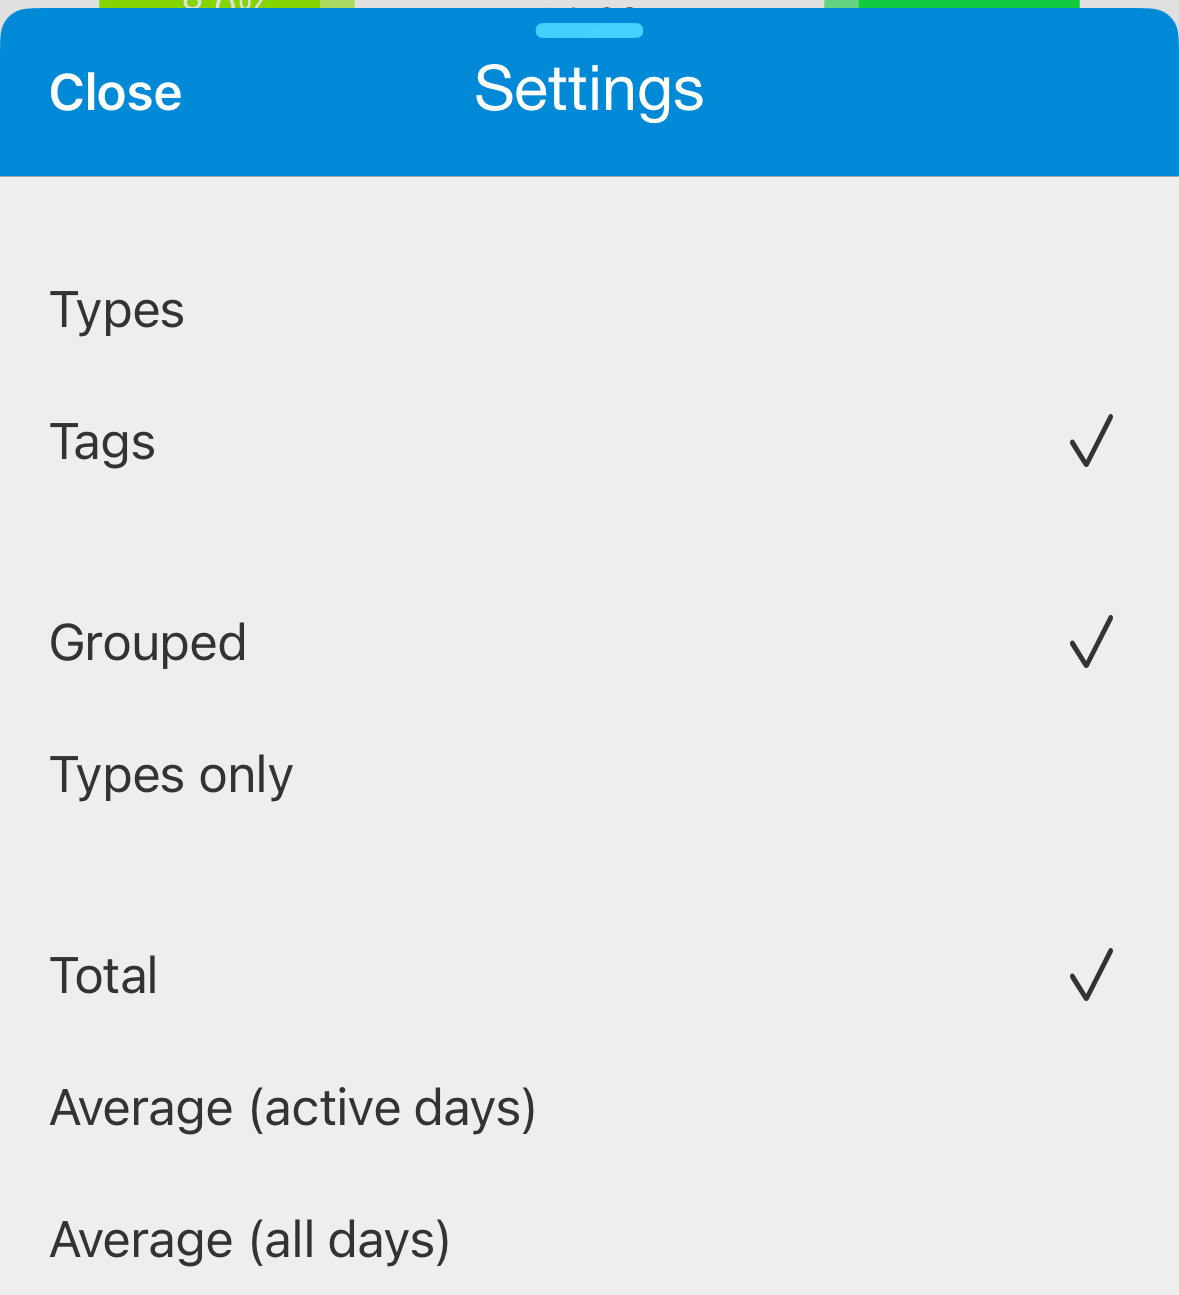
- By Activity Type or Tags
- Grouped or Flat (types only) Statistics
- Total / Average (Active Days) / Average (All Days)
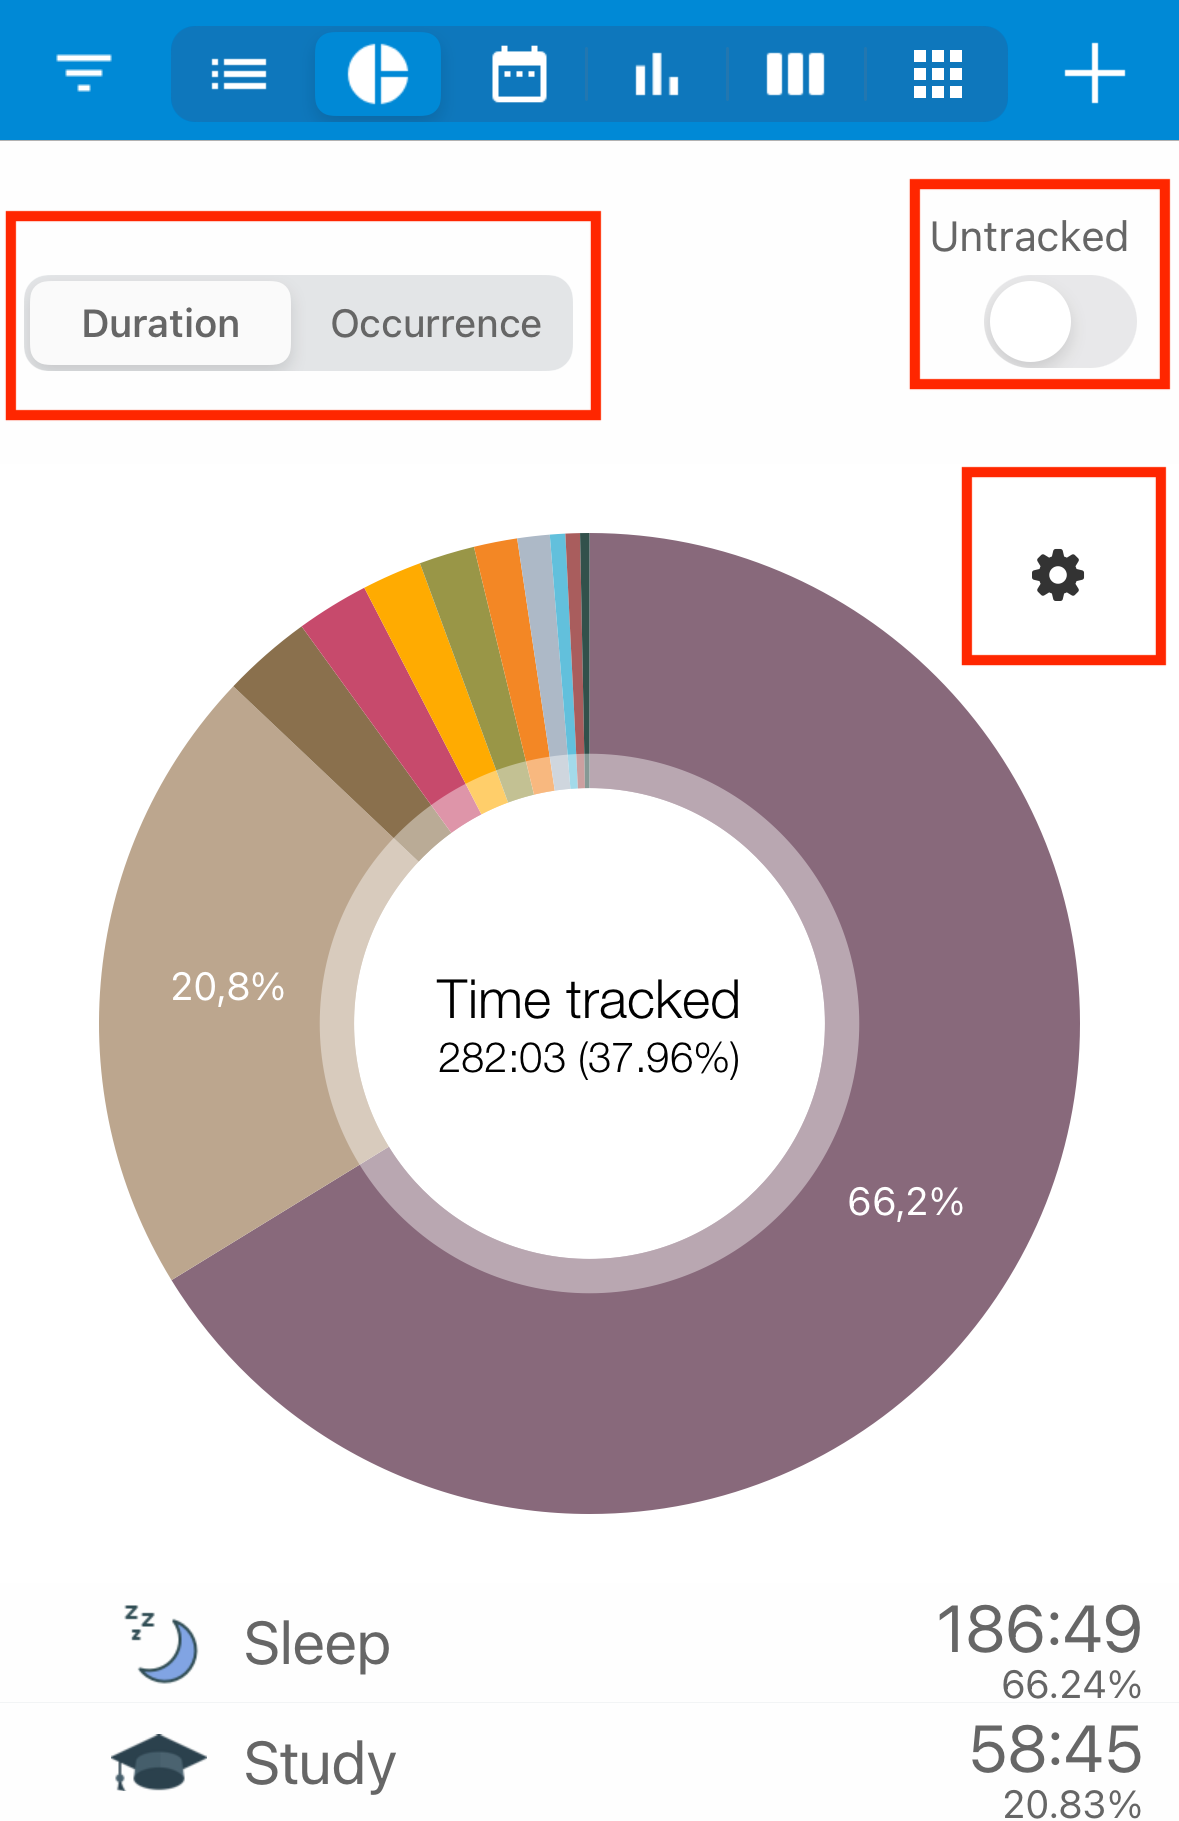
To set up the last three options, press the gear icon in the top right corner of the pie chart to open the menu.
Example
Let's say we have 5 records: * **Sleep:** 1:00 am - 8:00 am * **Work** / **Programming:** 8:00 am - 12:30 pm * **Work** / **QA:** 12:30 pm - 1:00 pm * **Dinner:** 1:00 pm - 2:00 pm * **Work** / **QA:** 2:00 pm - 7:00 pm **Total by duration**: * **Work**: 10h * **Programming:** 4h 30m * **QA**: 5h 30m * **Sleep:** - 7h * **Dinner**: 1h * **Untracked**: 6h **Total by occurrences:** * **Work:** 3 * **Programming:** 1 * **QA**: 2 * **Sleep**: 1 * **Dinner**: 1Daily chart
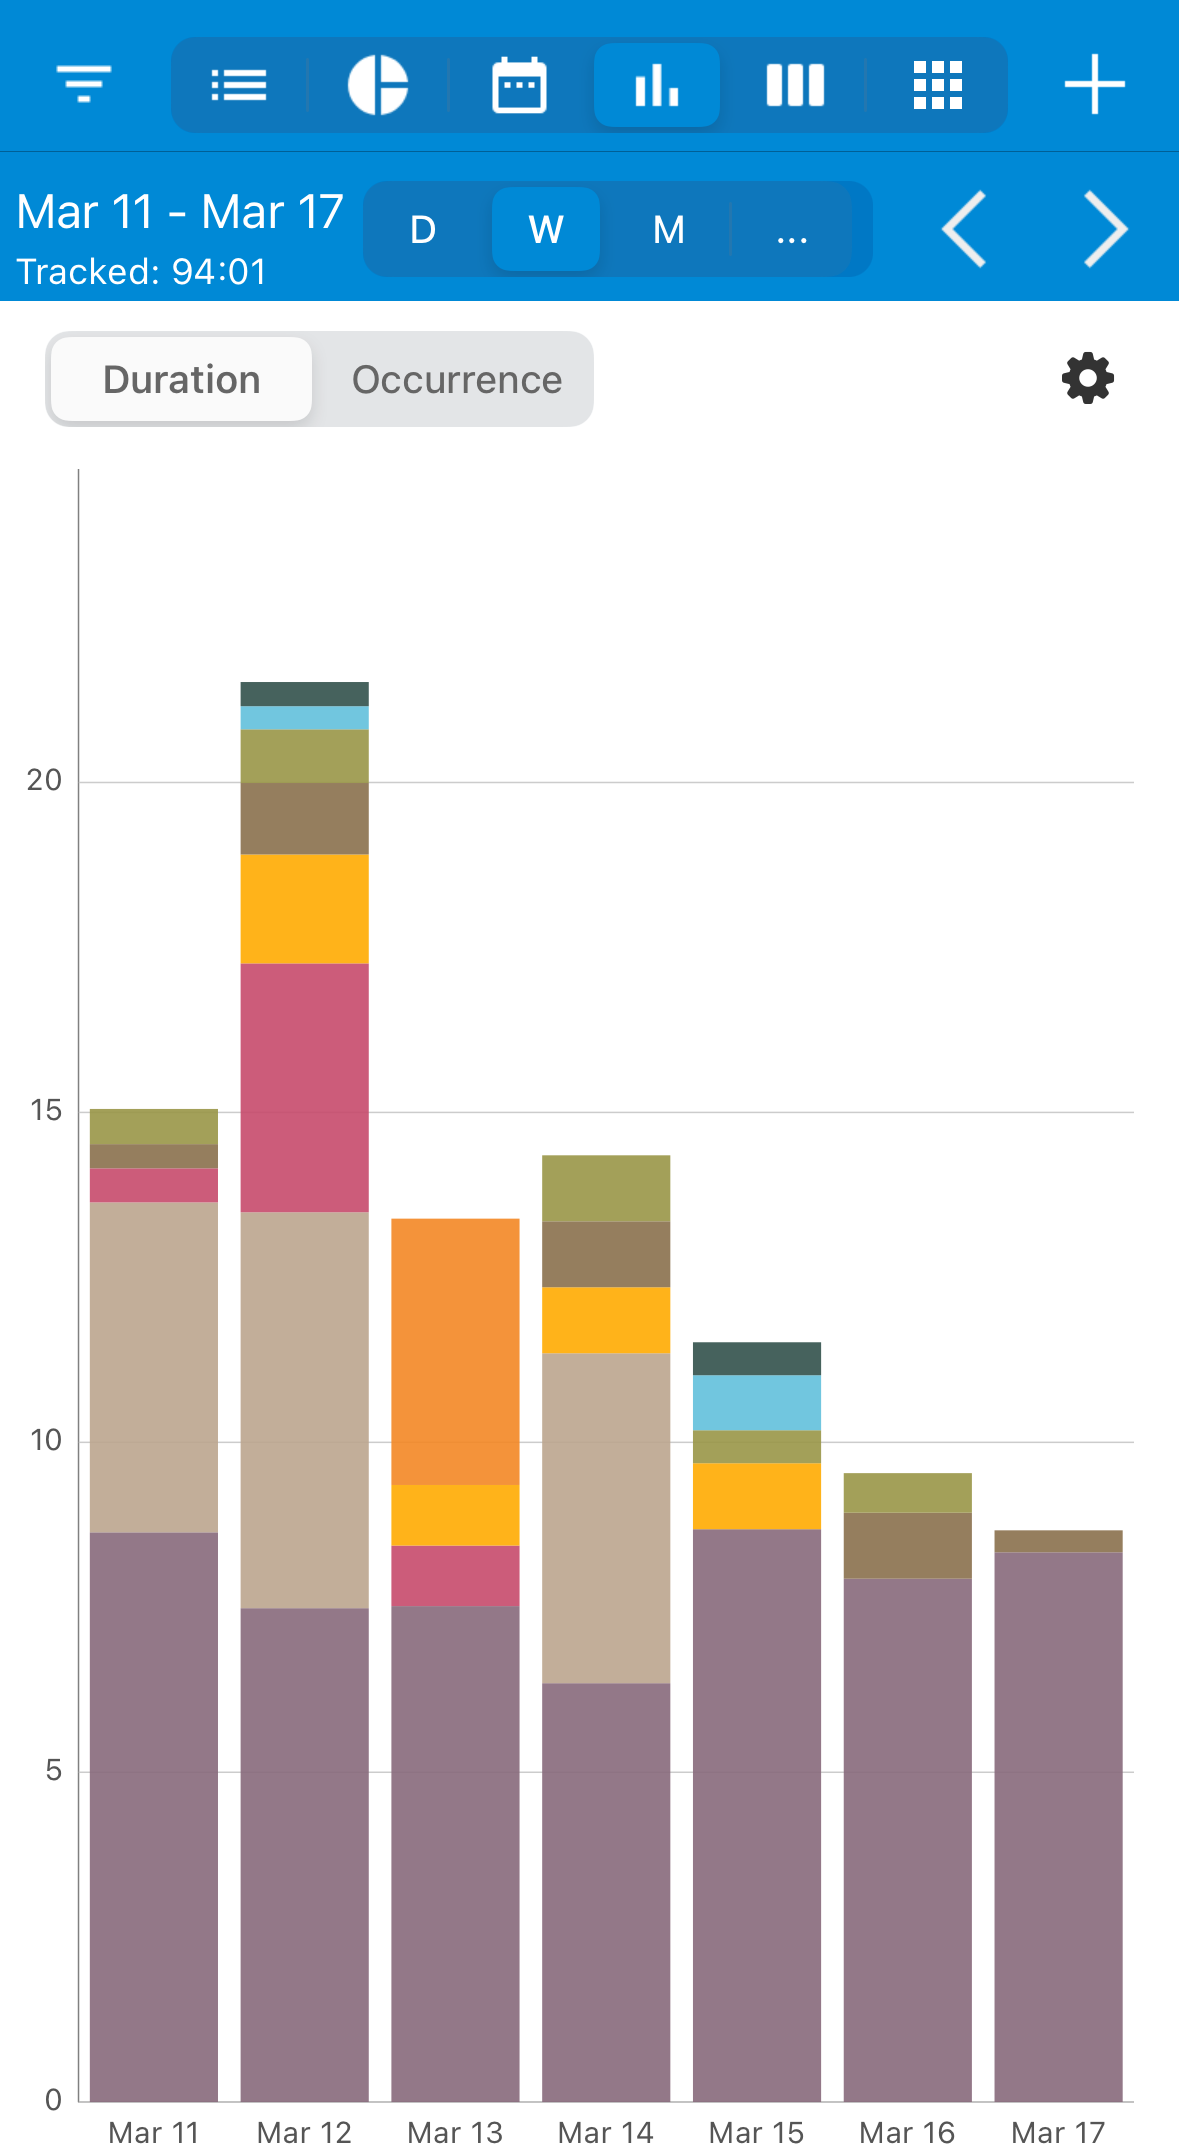
This chart displays total statistics grouped by day for the selected period, allowing you to see your daily progress. Options include:
- Duration / Occurrence
- Type / Tag
- Grouped / Types Only
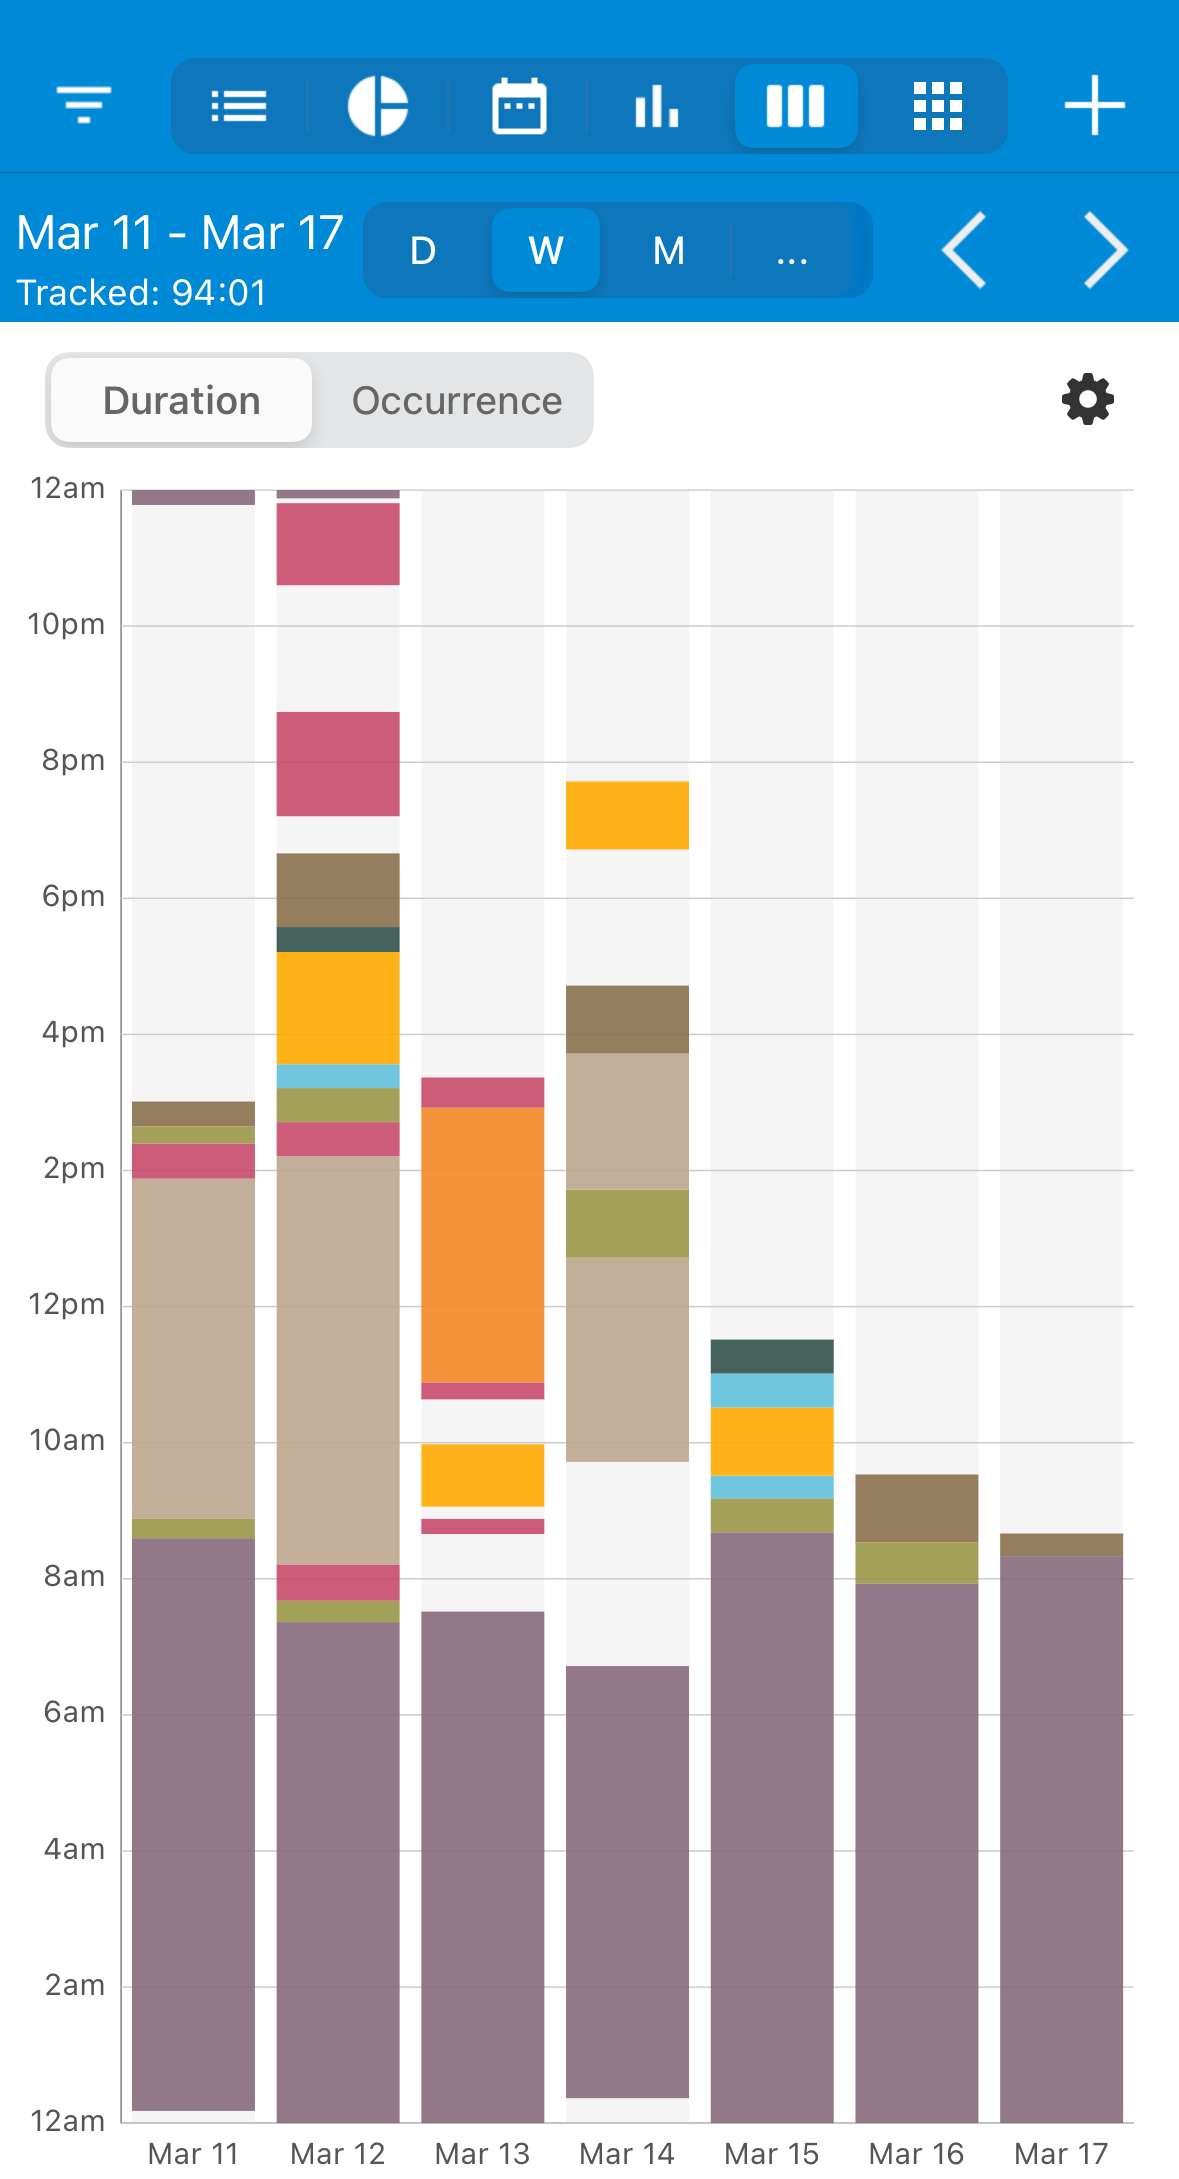
Distribution Chart
This chart shows the distribution of activities over time, helping you understand how your time is allocated throughout the day.